Although the Federal Reserve has cut interest rates to zero, in most market borrowing is becoming more difficult as liquidity dries up and interest rates rise.
Mortgage rates have increased about 30 basis points in the last week.
Due to low liquidity, yields on 10-year treasuries have also spiked in the past week, doubling to 1.1% even as risk has increased.
As liquidity has dried up, banks are raising interest rates on lending. “With short-term yields surging, U.S. Bank more than doubled the interest rate on $124 million of variable-rate bonds issued by Methodist Le Bonheur Healthcare to 5% — threatening to add almost $4 million a year to its annual debt payments.”
WSJ: Stocks down 5%, not surprising. What is a little surprising is yields on government bonds are rising — 10 year treasury now above 1%. Still insanely low, but shows that there are intense liquidity needs.
Oil is down to $27 a barrel. Prices at the pump have still only dropped about 25 cents, but nobody is driving anyway.
FT: The rise in bond yields is people liquidating that need cash.
The effect on the tourism industry seems to be cataclysmic.
FT: Mariott puts tens of thousands of employees on unpaid leave.
WSJ: “The U.S. Travel Association projected Tuesday that total spending on travel in the U.S., including transportation, lodging, retail, attractions and restaurants, would plunge by $355 billion for the year—and that 4.6 million American jobs would be lost.”
“Hotel owners in most every major urban market in the U.S. are now experiencing occupancy levels around 20% or less, a rate that will make it challenging to meet payroll, let alone pay other expenses and meet debt obligations, owners said.”
“American Airlines Group Inc., the world’s biggest carrier, will fly to only two long-haul destinations—Tokyo and London. Executives at British Airways, Korean Air and other large airlines have said they are in a battle for survival. Many smaller carriers, which form the bedrock of the 13,000 new jets ordered from Airbus SE and Boeing Co., have less access to new capital, and aren’t expected to survive.”
Transmission is mostly within families. “In China, human-to-human transmission of the COVID-19 virus is largely occurring in families.”
At least this report doesn’t seem to think that asymptomatic infection is important. “Asymptomatic infection has been reported, but the majority of the relatively rare cases who are asymptomatic on the date of identification/report went on to develop disease. The proportion of truly asymptomatic infections is unclear but appears to be relatively rare and does not appear to be a major driver of transmission.”
Incubation period of 5-6 days
Based on available information, the median time from symptom onset to laboratory confirmation nationally decreased from 12 days (range 8-18 days) in early January to 3 days (1-7) by early February 2020, and in Wuhan from 15 days (10-21) to 5 days (3-9), respectively.
“China has a policy of meticulous case and contact identification for COVID-19. For example, in Wuhan more than 1800 teams of epidemiologists, with a minimum of 5 people/team, are tracing tens of thousands of contacts a day. Contact follow up is painstaking, with a high percentage of identified close contacts completing medical observation. Between 1% and 5% of contacts were subsequently laboratory confirmed cases of COVID-19, depending on location.”
8. What is the secret to South Korea’s success? 74 cases March 18th down from 909 at the peak. Done so without taking authoritarian measures. Tested more than 270,000 people. This, along with contact tracing, and case isolation.
Still early, because a lot of their cases were within one church group.
Earlier experience with Mers showed laboratory testing is the key.
Korean Center for Disease control developed tests, cooperated with diagnostic manufacturers to develop commercial test kits.
Close contacts and those with minimal symptoms whose family members are free of chronic diseases and who can measure their own temperatures are ordered to self-quarantine for 2 weeks. A local monitoring team calls twice daily to make sure the quarantined stay put and to ask about symptoms. Quarantine violators face up to 3 million won ($2500) fines. If a recent bill becomes law, the fine will go up to 10 million won and as much as a year in jail.
Still, the numbers of new cases have dropped the past 2 weeks, aided by voluntary social distancing, both in the Daegu-Gyeongbuk region and nationwide. The government advised people to wear masks, wash their hands, avoid crowds and meetings, work remotely, and to join online religious services instead of going to churches.
The government hopes to control new clusters in the same way it confronted the one in Shincheonji. The national testing capacity has reached a staggering 15,000 tests per day. There are 43 drive-through testing stations nationwide.
Latest numbers below. For a number of states we are starting to get the full picture. Total of 2,265,108 claims from 37 states. Best estimate for total claims for all 50 states is 3.8 million.
Latest numbers below. For a number of states we are starting to get the full picture. Total of 2,087,000 claims from 37 states. Best estimate for total claims 3.8 million.
Updated data below. For the 29 states I have data, there is a total of 1,822,979 new unemployment claims over the past week. However, of the 29 states, some states only report claims for a few days. If I assume the average claims of the non-reported days are the same, this comes out to 2,800,000 claims for the week for the 29 states. This is about 2.5% of the total civilian labor force in these states. Applying this number to the non-reporting states, this gives a total of 4,146,920 new unemployment claims for the week.
This calculation assumes that (i) for states that have reported, non-reporting days are similar to reporting days, and (ii) states that have not reported are similar to states that have reported.
Latest figures. The total from 21 states (sum doesn’t include NY and TX which are listed below) is 883,047, but keep in mind many states have only reported a few days of claims.
Colorado 3,900 on Monday, 6,800 Tuesday as of 10:00 am. Compare with 400 last Monday.
Rhode Island (2nd source) 6,282 on Monday, and 17,779 in the last 8 days. Now, 30,000 in the last 9 days. Compare with 10 last week
Ohio 12,000 on Sunday, 36,645 Monday, 21335 Tuesday, 33,238 Wednesday . Compare with 562 last Sunday.
Connecticut (2nd source) (3rd source) Friday 2000, Sat & Sun 8000, Mon 10,000, Tuesday 10,000 , Wednesday 12,000. Now 56,000 for the week.
Hawaii 1500 on Monday, 3000 on Tuesday, compared to 300 last Monday.
Mass Monday, 19,884 filed, compare with 17,382 entire month of February.
Tennessee 6,092 since March 8, compare to 2,031 previous week
Minnesota (2nd source) 31,000 on Monday and Tuesday, more than 10 times total from last week. 50,000 on Wednesday
Michigan 5,400 on Monday, compared to 1,300 normal
Kentucky (2nd source) 9,000 on Tuesday, compared with normal 2,000 / week. Sunday through Tuesday, 17,230
Pennsylvania (2nd source) 50,000 on Monday, more than 50,000 on Tuesday, compare to 14,000 first week of March. Now, total is 121,000 online applications. Now 180,000 Tuesday, Wednesday, Thusrday.
Texas 16,000 last week, compared with 4,500 the previous week
Louisiana (2nd source) (3rd source) 3,600 on Monday and Tuesday, compared to 1,698 for week ending March 7. New source says 11,000 on Tuesday. New source 30,000 since Sunday.
Maine 4,900 Sunday, Monday and Tuesday, more than March of 2019
New York Office receive 21,000 calls by noon Tuesday, compare with 2,000 calls total last week
Illinois 41,000 on Tuesday and Wednesday, compared with 4,500 same two days 2019
North Carolina 4,700 Monday and Tuesday, compared to normal 3,500 per week
Oregon 18000 on Tuesday March 17, compare to 800 Sunday March 15
California Sunday, 40,000, Monday 70,000, Tuesday 80,000, compare to normal 2,000 daily
March 17: The data is sparse of course at this point. One data point is the New York Manufacturing survey, where an overall index of activity fell by 34 points, the largest fall ever and similar to level seen during the Great Recession.
In Europe many factories are shutting down, either because of the virus or because of supply chain disruptions. France’s PSA (Peugeut, Opel, etc) is closing all European plants. Michelin is shutting factories in France, Italy, and Spain for a minimum of one week. Volkswagen is set to shut its main plant within days because of supply chain issues.
There can and should be resistance to the government just handing out cash to the corporations. See this nice Op-Ed by Tim Wu. For years airlines have abused their market power to saddle consumers with absurdly awful service, high feeds, and low quality, while making record profits. Instead of saving the profits for a rainy day, they have saddled the companies with debt, and used most of their cash flow for dividends and buybacks.
In France, a number of packages are being considered: €32 billion in deferred tax and social security, €8.5 billion for two month payments to workers temporarily laid off, €300 billion for bank loans for businesses.
March 17 – Trump administration proposes $850 stimulus. Seems that this is $50 billion for airlines, $800 billion in payroll tax cuts. May also be some help for other industries, such as hotels, etc.
The market for short term commercial paper is freezing up. The difference between the three-month commercial paper interest rate and the benchmark government overnight indexed swap rate increased to over 1 percentage point, from 0.24 points at the start of the month. Total amount of commercial paper outstanding is $1.1 trillion.
March 17: Fed launches $10 billion fund to help liquidity in commercial paper.
Bank Lending
Bank lending is also freezing up. Overnight interest spread for between bank lending is increasing.
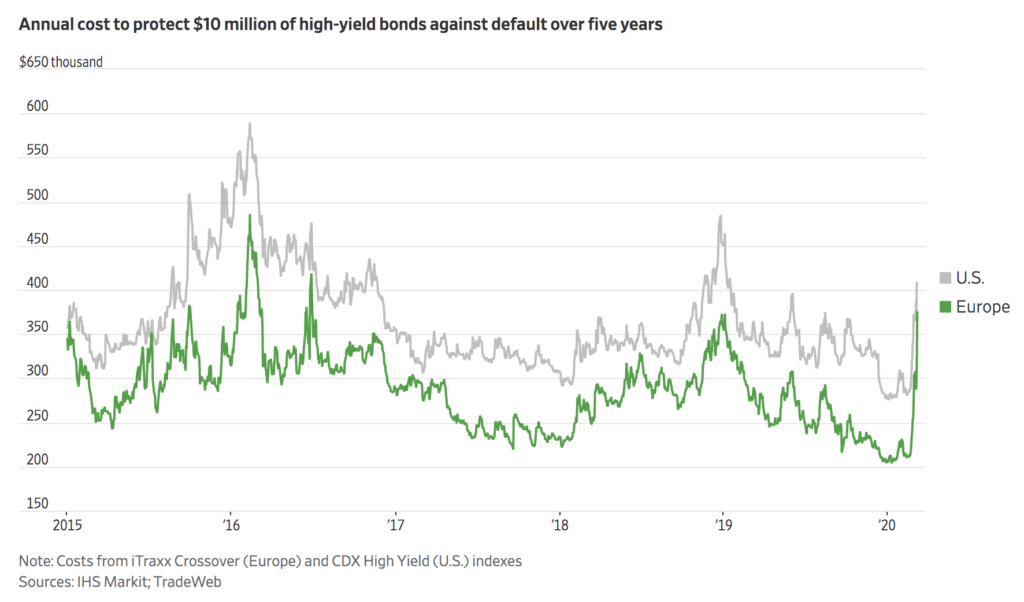
High yield debt
The performance of corporate bond markets has held up surprisingly well. The S&P high yield bond index is down about 13% as of March 16. The cost of insuring bonds against default, however, has been rapidly increasing
Municipal bonds
Muni bond market is doing okay, only off 1.2% as of March 16.
Redfin CEO: Housing is down, but from high levels. Interesting commentary on Mortgage market: “One bullet that the government fired to help housing this week didn’t hit its mark. Even as the Federal Reserve has lowered the federal funds rate to zero, mortgage rates have increased about 30 basis points, from a low of nearly 3% in early March. Money has only gotten cheaper, but the people originating loans can’t keep up with demand; volume is so high that lenders are taking profits.”
March 16
Although interest rates have been pushed to the zero lower bound, mortgage interest rates seem to be increasing, at least for now. The reason is that banks don’t want to hold the mortgages, and nobody wants to hold mortgage backed securities. Spread between 10 year treasury and mortgage rates is now over 3 percentage points.
Although mortgage rates are increasing, it seems that mortgage refinancers are not yet informed about this, and they are submitting refinance applications at a record place.
March 17: Mortgage rates now dropping, down to 4.1%.