Over the long run, the stock market has always gone up. This is the conclusion drawn from “Stocks for the Long Run”, Jeremy Siegel’s book about the long run returns of different asset classes. The real (inflation adjusted) returns on stocks from 1802-1871 was 7.0%. From 1872-2018, the real return was not much changed, 6.76%. During the post-war period, 1946-2018, returns were likewise similar at 6.82%. This remarkable stability of long-term real returns is a characteristic of mean reversion for equity prices.
But within this stability of long-run returns, there have been important changes in the structure of returns over the past four decades. Stocks used to generated returns primarily through paying dividends, and to a lesser extent through price appreciation. From 1872-1979, 80% of stock returns were from dividends paid out, while 20% of returns came from price appreciation. But there was a reversal of this from 1980-2018: during this period 65% of returns came from price appreciation, and 35% from dividends.
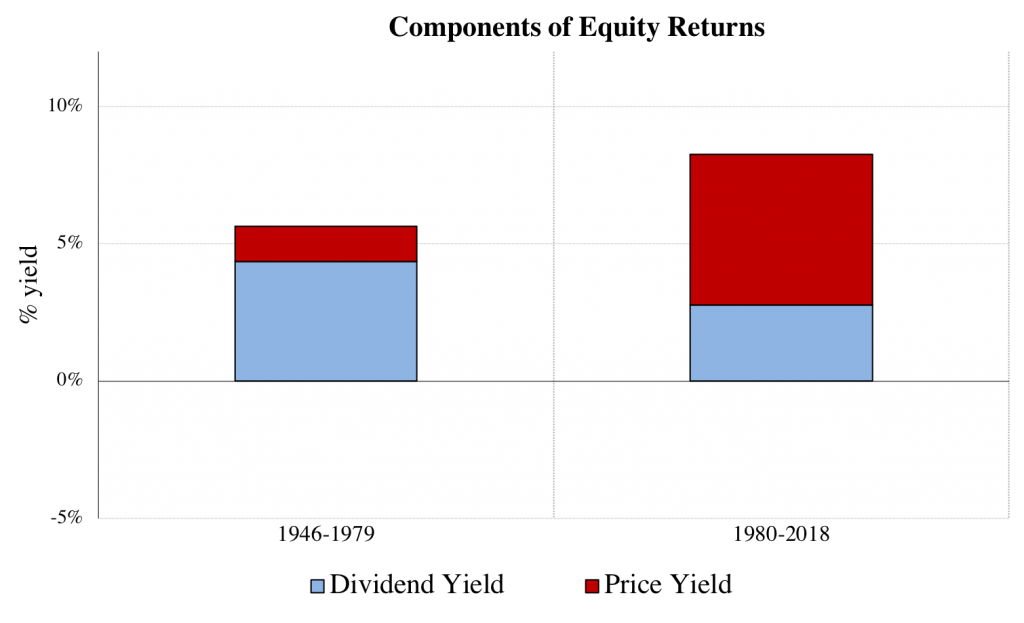
Figure 1 decomposes total equity returns into its components: dividends and capital gains. We see that there has been a key shift over time away from dividends and towards capital gains.

There have also been shifts in the composition of bond returns over these two periods. Unfortunately for bond investors, over the long run the bond market has not always yielded high or constant returns. Figure 2 breaks down the inflation adjusted return on bonds in the postwar period. From 1946-1979, the average real bond return was negative, as inflation wiped away the value of coupons, while rising interest rates lead to capital losses on bonds. The story is quite different in the post-1980 period: low and stable inflation, combined with a fall in interest rates, led to adequate returns, although still lower than stocks. As Siegel notes, although stocks are riskier than bonds over short holding periods, once the holding period increases to between 15 and 20 years, the standard deviation of average annual returns become lower than the standard deviation of average bond returns. Over 30-year periods, equity risk falls to only two-thirds that of bonds.
While the cause of the shift in bond returns is straightforward enough, that of equity is more difficult. One important force that may be driving capital gains is the changing nature of corporate payouts. Instead of returning their earnings to shareholders through dividends, firms may be reinvesting their earnings, or using the cash to purchase their own shares — stock buybacks. Both uses of cash would boost share prices, relative to a dividend payout. There has been a lot of recent attention of the rise of corporate buybacks in the US, and this has certainly played a role– more about that in a future post.
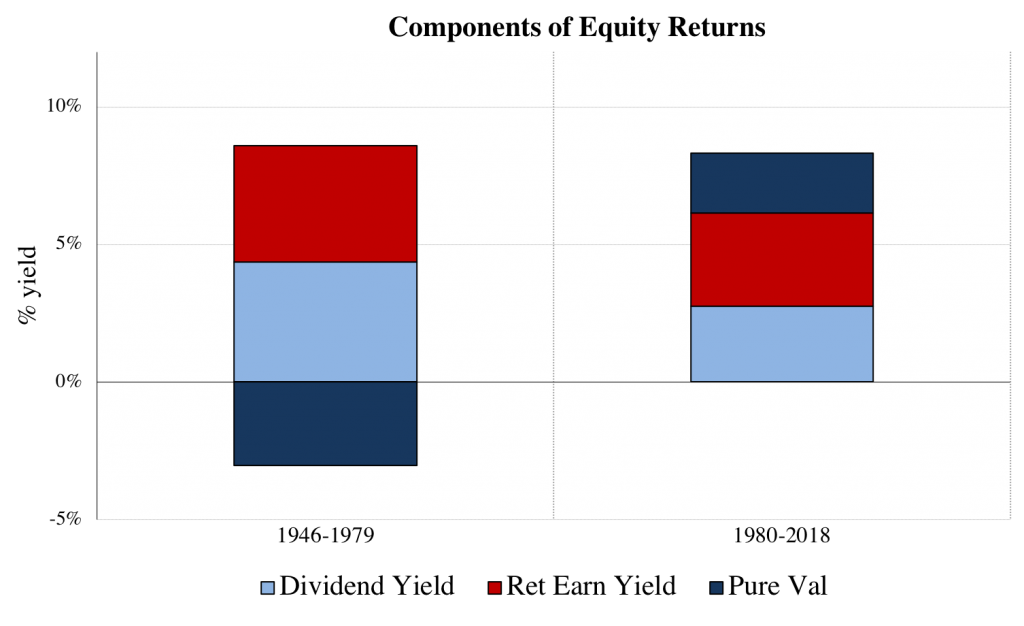
For now I want to examine to what extent capital gains are being driven by retained earnings. Under a Miller-Modigliani (1961) assumption that a dollar of post-tax earnings that is not paid out by the firm increases the value of the firm by a dollar, we can break down the amount by which price increases are being driven by retained earnings. The “price return” component of figure 1 is thus broken into two components in figure 3: a retained earnings yield, and a pure valuation increase. Pure valuations were negative for the first few decades of the post-war period, but since 1980 they have been positive and large.
The changing nature of returns has lead to a changing nature of income in the US, the increased importance of capital gains. More about this in future posts!